


”Survey says” looks at various rankings and scorecards judging geographic locations, while noting these grades are best seen as a mix of artful interpretation and data.
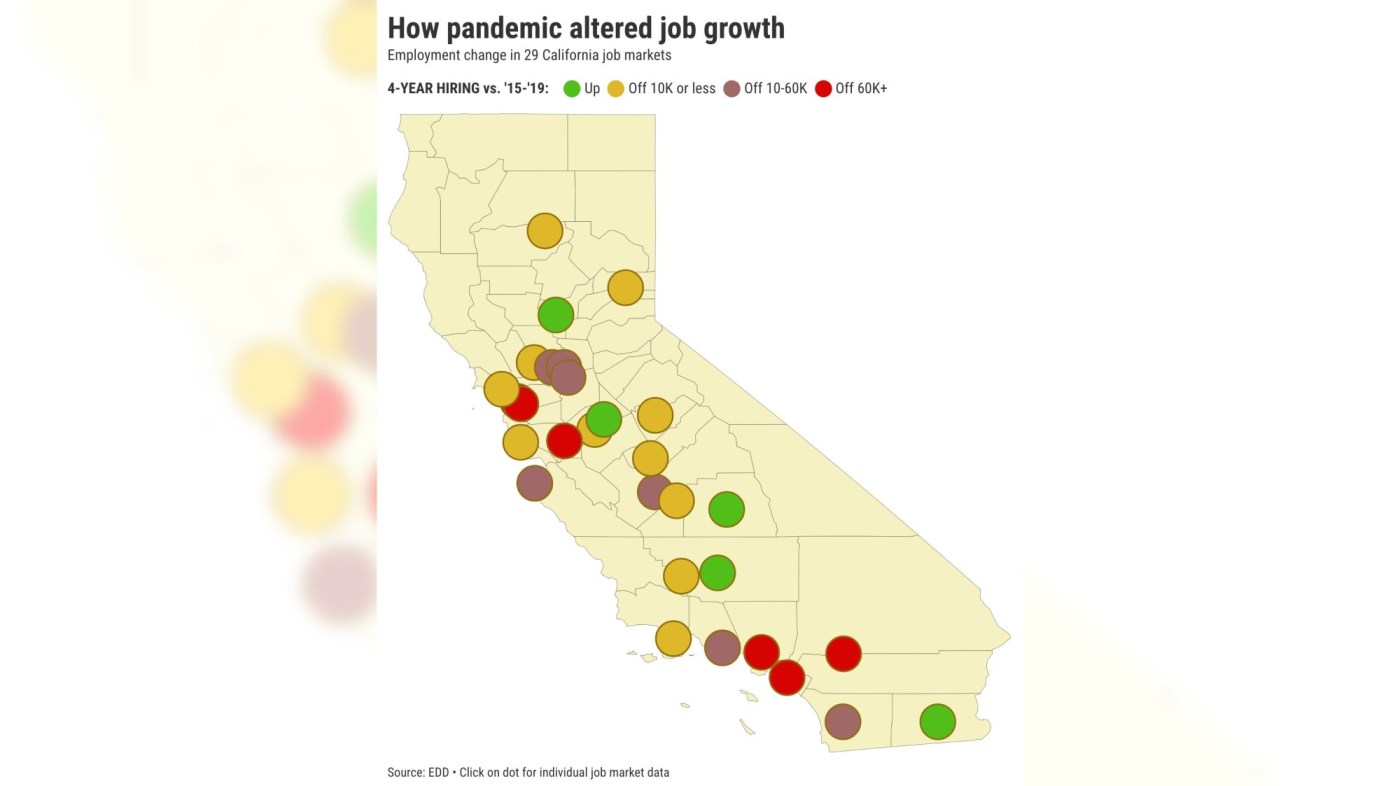
Buzz: The Inland Empire was California’s top job creator during the past four years.
Source: My trusty spreadsheet looked a state employment stats for 29 regional job markets – focusing on average 2023 employment vs. 2019, the year before the pandemic hit.
Topline
The region comprising Riverside and San Bernardino counties may be California’s most under-appreciated economic asset.
The Inland Empire averaged 1.68 million workers last year – up 128,400 vs. 2019. That gain easily was No. 1 among the state’s job markets.
Or look at the outperformance this way. California added 640,300 jobs since 2019 to 18.1 million. So, the Inland Empire created 20% of the state’s new jobs but comprises only 9% of the state’s total employment.
The COVID-19 pandemic was a key driver in the Inland Empire’s job growth as the push for online shopping fueled rapid growth in logistics work. The region is a hot spot for transportation, warehouse and utilities employment.
Consider that the Inland Empire last year had 209,000 of the state’s 865,000 logistics jobs — a 24% share. Yet the Riverside-San Bernardino region added 61,500 of these jobs in four years, 40% of California’s new 157,000 logistics workers.
Details
Los Angeles County was No. 2 for job growth during the past four years with 79,000 jobs added to 4.6 million, the state’s largest job market. Other big job increases were in …
San Diego County: 69,900 added since 2019 to 1.6 million.
Sacramento: 67,600 added since 2019 to 1.1 million.
Orange County: 39,000 added since 2019 to 1.7 million.
San Jose-Santa Clara: 36,500 added since 2019 to 1.2 million.
Stockton: 30,700 added since 2019 to 278,000. That 12.4% growth was No. 1 among the metros.
Fresno: 26,900 added since 2019 to 390,000.
San Francisco: 26,300 added since 2019 to 1.2 million.
Bakersfield: 18,500 added since 2019 to 292,000.
Visalia-Porterville: 13,200 added since 2019 to 142,000.
Oakland-Berkeley: 11,400 added since 2019 to 1.2 million.
Bottom line
Note that employment in four smaller job markets remains below 2019 levels.
San Rafael’s off 4,600 workers to 112,000, Chico’s down 2,300 to 78,000, Santa Cruz declined by 1,000 to 103,000, and Napa dropped 300 jobs to 75,000.
Jonathan Lansner is the business columnist for the Southern California News Group. He can be reached at [email protected]
California exodus?
California interstate departures fell 3% in 2022, arrivals grew 10%
817,669 Californians left in 2022. Which state did they move to?
475,803 moved to California last year. What states did they come from?
Hot job markets are No. 1 draw for ex-Californians
State added 37,010 million-dollar taxpayers in 5 years, most in US
Golden State has 4th ‘stickiest’ population in US, Fed says
Van moves suggest California ‘exodus’ is slowing
Related Articles
Blizzard and Activision hit with layoffs as Microsoft cuts 1,900 jobs
Campus jobs are ‘real work’: 20,000 California college students begin union vote
These 5 Bay Area cities have the highest minimum wage in the U.S.
Why Cheesecake Factory wage theft case in Orange County matters for California
One Bay Area city went far beyond what others were willing to pay to recruit officers. Did it pay off?


+ There are no comments
Add yours